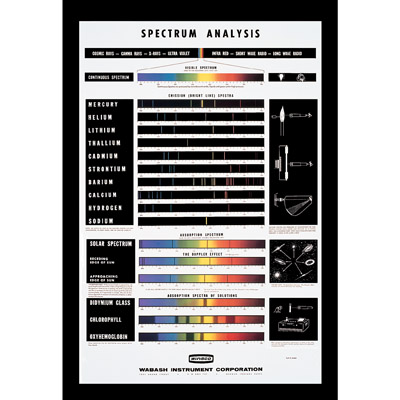
This chart shows the visible continuous spectrum of the sun and the emission or bright line spectra of ten relatively common elements. It provides an excellent beginning point to show the student the total individuality of the spectrum of each element. It further presents an
opportunity to discuss the general relationship between the number of lines and the number of atomic shell electrons. Also shown is an explanation of the "red shift" or Doppler Effect which is a change in the perceived frequency, usually of the absorption of Fraunhofer line. A number of line drawings show how spectra may be produced or clarify other aspects of the importance of spectral analysis. This durable chart is
printed on heavy paper stock and is fitted with metal binding strips at top and bottom. The upper strip includes a tab suitable for wall hanging.